Live Latency Performance Test Report¶
| Attribute | Value |
|---|---|
| Document type | Test report (method + result analysis) |
| Subject | PPCDN end-to-end live latency: ppobs publish → ingest → delivery → pplayer playback |
| Key metric | End-to-end latency (the player panel's "P2P Delay") |
| Result summary | P2P direct 70ms, WHIP ingest 108ms, SRT ingest 386ms |
| Updated | 2026-09-29 |
0. Summary¶
After tuning, the measured end-to-end latency of three access/playback modes:
| Scenario | Path | Measured | Screenshot |
|---|---|---|---|
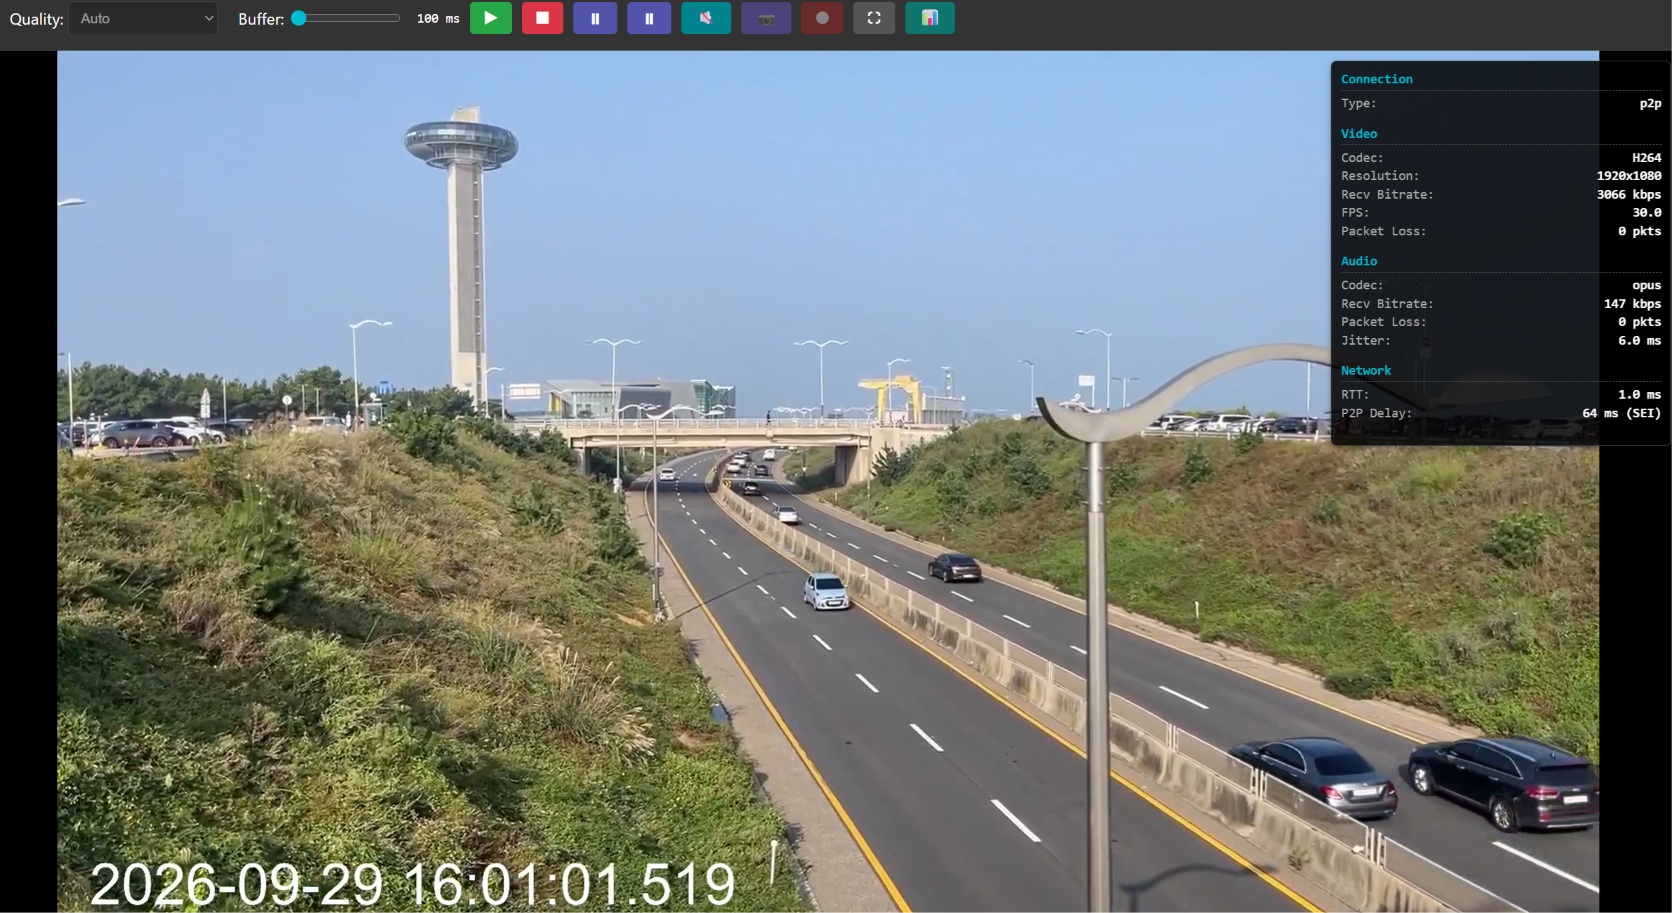
| P2P direct | Player ↔ publisher direct (no Edge) | 70ms | §4.1 |
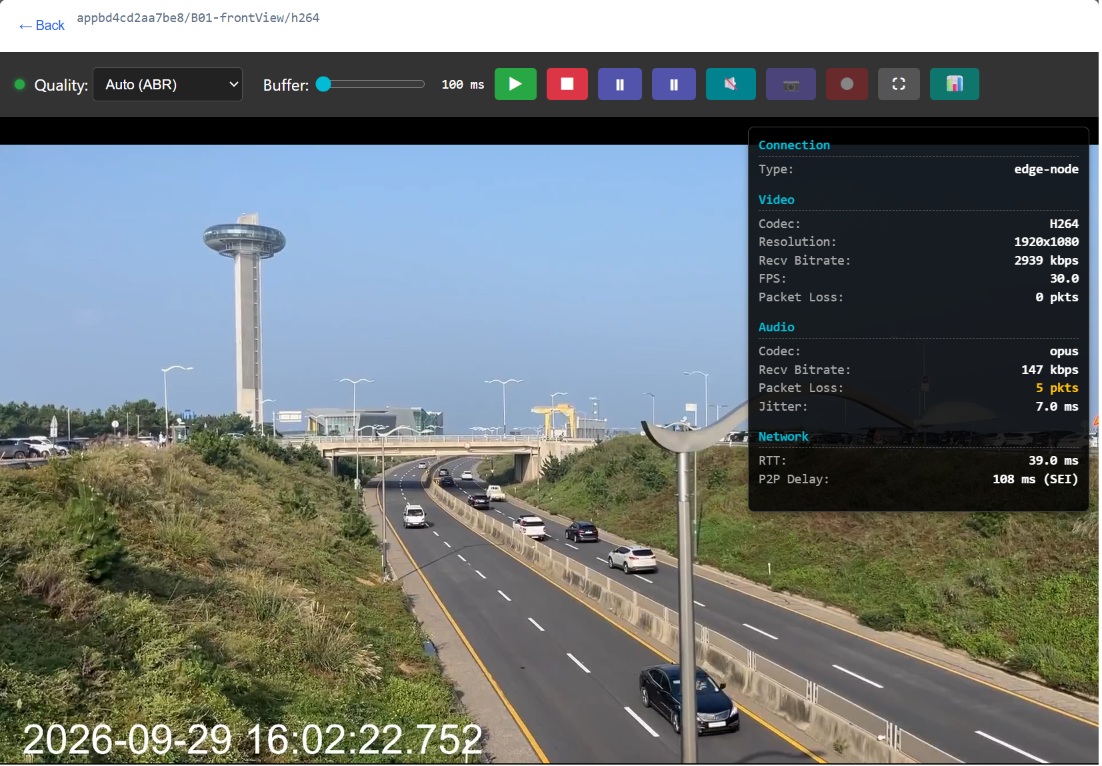
| WHIP ingest | WHIP ingest → Edge delivery → playback | 108ms | §4.2 |
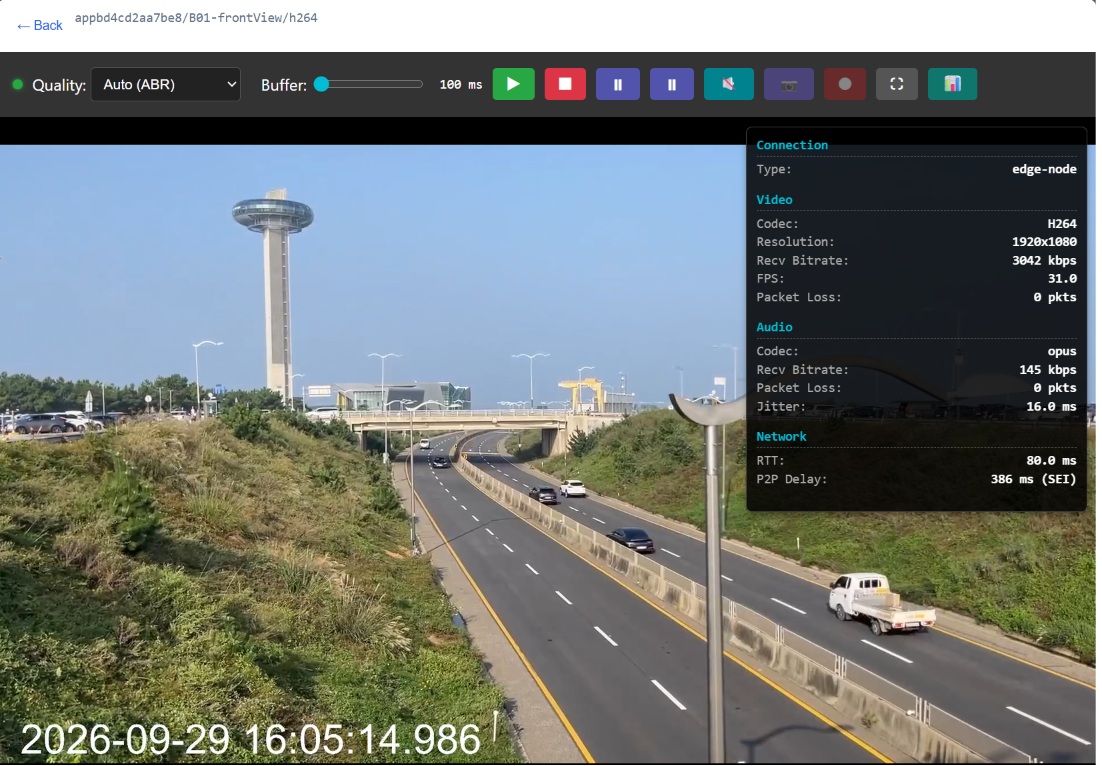
| SRT ingest | SRT ingest → Edge delivery → playback | 386ms | §4.3 |
Conclusion: latency P2P < WHIP < SRT. SRT is about 278ms higher than WHIP, mainly from the ingest-side SRT receive window (TSBPD), a fixed delivery delay; WHIP ingest has no such window and is clearly lower; P2P direct has the shortest path and the lowest latency.
1. Goal & scope¶
- Quantify and compare P2P direct, WHIP ingest and SRT ingest end-to-end latency.
- Verify the latency gains after tuning and document a reproducible, publishable method.
Not tested: throughput ceiling, concurrency scale, billing correctness, recording path.
2. Metric definition and measurement principle¶
2.1 End-to-end latency¶
The one-way delay from the ppobs capture instant (in-bitstream mark) to pplayer rendering, covering capture, encode, ingest, delivery (Origin→Edge or P2P direct), jitter buffer and decode. The player panel's "P2P Delay" is this value (the label is shared by the Edge / P2P paths; the actual path is shown as Connection in the panel).
2.2 Measurement path¶
- ppobs writes an absolute UTC timestamp into the bitstream (H.264/H.265 SEI); Origin/Edge pass it through hop by hop without decoding or transcoding.
- ppplayer subtracts it from a clock calibrated against ppcenter:
corrected_now   = local_clock + offset
one_way_delay   = corrected_now - embedded_timestamp
- Readings add a fixed +50ms compensation for the encode/decode/render overhead between the mark and rendering that cannot be measured directly.
- Cross-browser measurable: to avoid non-Chromium browsers (e.g. iOS Safari, which
lacks WebCodecs Insertable Streams and cannot read the in-bitstream SEI) seeing only
an estimate, Edge nodes parse the ingest stream's SEI and push
OBS_TIMESTAMPto the player over the ABR control WebSocket, so the measured value is readable on iOS Safari too.
2.3 Boundaries¶
- Readings come from the ppplayer panel; full percentiles are aggregated per minute/day by ppcenter and visible in the console.
- Single machine, single stream, limited window — it does not represent a network-wide SLA.
3. Test configuration¶
| Item | Value |
|---|---|
| Publisher | ppobs |
| Ingest / connection | P2P direct / WHIP / SRT (three-way comparison) |
| Codec | H.264 (HEVC included in multitrack scenarios) |
| Player | pplayer |
| Playback buffer | ppplayer default |
4. Measured results¶
4.1 P2P direct — 70ms¶
The player is P2P-direct to the publisher (no Edge); end-to-end latency 70ms.
4.2 WHIP ingest — 108ms¶
WHIP ingest, Edge delivery; end-to-end latency 108ms.
4.3 SRT ingest — 386ms¶
SRT ingest, Edge delivery; end-to-end latency 386ms.
5. Analysis¶
| Scenario | Measured | vs WHIP | Main difference |
|---|---|---|---|
| P2P direct | 70ms | −38ms | Shortest path: player directly to publisher, no ingest/cascade |
| WHIP ingest | 108ms | baseline | No TSBPD receive window, small ingest overhead |
| SRT ingest | 386ms | +278ms | Ingest SRT receive window (TSBPD) adds a fixed delivery delay, plus weak-network retransmit buffering |
- P2P direct is lowest: it removes the Origin→Edge cascade and ingest queue, leaving only capture/encode + end-to-end network + decode/render.
- WHIP beats SRT: WHIP is WebRTC-based and has no fixed TSBPD receive window on ingest — consistent with the design intent (SRT's receive window is deliberately enlarged for weak-network retransmission: a loss-robustness ↔ latency trade-off).
- SRT is highest: the ~278ms overhead closely matches the SRT receive window (hundreds of ms at its floor); on a lossy uplink, retransmission/receive buffering pushes it higher. On a clean uplink SRT falls back near its receive-window floor.
- The gaps are stable and reproducible, indicating the difference comes from the protocol/link structure, not occasional noise.
6. SLA note¶
| Metric | Target | Ceiling | Path |
|---|---|---|---|
| P80 | ≤ 300ms | ≤ 600ms | P2P direct |
| P99 | ≤ 2s | — | P2P direct |
This test's P2P direct 70ms is well within the P80 target (≤300ms). Note the SRT ingest path's latency is governed by the ingest receive window and is not the same metric as the P2P direct SLA.
7. Conclusion & limitations¶
Conclusion
- End-to-end: P2P direct (70ms) < WHIP ingest (108ms) < SRT ingest (386ms).
- For the lowest latency, prefer P2P direct, then WHIP ingest; SRT ingest trades several times WHIP's latency for weak-uplink retransmission robustness — the choice depends on your tolerance for weak networks.
Known limitations
- Single machine, single stream, limited window — not a network-wide SLA.
- SRT readings depend on uplink loss/retransmission and receive-window adaptation, and vary over time.
- Mobile devices are strongly affected by carrier network and signal strength.
8. Revision history¶
| Date | Revision | Notes |
|---|---|---|
| 2026-09-26 | Draft | Test plan finalized |
| 2026-09-29 | Results | Merged end-to-end latency analysis; added 5-scenario measurements |
| 2026-09-29 | Tuned results | Updated to a P2P/WHIP/SRT comparison (70/108/386ms) with screenshots |